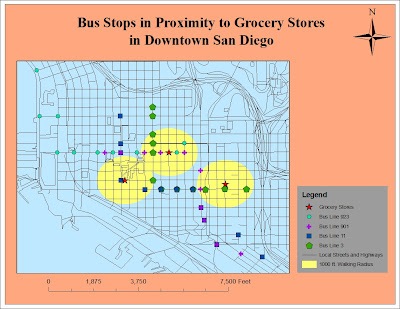
Figure 1: Map of Geocoded Bus Stops and Grocery Stores in Downtown San Diego
Table 1: Stops for Bus Line 3
Table 2: Stops for Bus Line 11
Table 3: Stops for Bus Line 901
Table 4: Stops for Bus Line 923
Table 5: Addresses for Grocery Stores
For this assignment I geocoded the addresses of grocery stores and various transit stops in downtown San Diego. Since I am from San Diego and have observed the lifestyles and behaviors of people who live downtown, I thought I would try to solve a common problem. In many downtown areas, high density creates more obstacles for having a personal vehicle, such as traffic and lack of parking. Furthermore many of these residents live and work in this downtown area, further decreasing their need for a car. However, there are certain activities that can be difficult to do without a car, like grocery shopping. Therefore, I decided to geocode the addresses of three major grocery stores and four of the major bus lines that serve downtown San Diego.
The bus stops and grocery stores were all geocoded in the context of the street system of downtown San Diego, which was obtained from 2009 Census data. The red stars represent the three largest grocery stores and the yellow buffer around each star represents a 1000-foot walking distance. This buffer displays the easy walking distance between each grocery store and several bus stops, which serve the majority of the downtown area. Furthermore, many of these bus lines overlap which provides easy transfer points for residents traveling to the outskirts of the region.
Although this project may be irrelevant for savvy transit users, it communicates an alternative for residents who are still reliant on cars. For example, the manager of an apartment building in downtown San Diego may show this map to potential tenants in order to demonstrate transit as an effective alternative to cars, thereby decreasing the need for expensive parking structures for the apartment building. In order for public transit ridership to increase, the accessibility, convenience, and efficiency must be communicated to the general population. A common activity like grocery shopping can appeal to everyone. Therefore, by visually representing the close connections between grocery stores and transit stops, residents of dense urban centers may realize the advantage of public transportation over the hassle of using a car.
Citations:
"Topologically Integrated Geographic Encoding and Referencing system." U.S. Census Bureau. <http://www.census.gov/geo/www/tiger>.
"Maps and Time Tables." San Diego Metropolitan Transit System. <http://www.sdmts.com/map_timetable>.


